The global flow of people
27.3.2014 by ramon bauer
A circular data visualisation that makes international migration flow data more accessible.
Measuring global migration flows is a difficult task because data on bilateral international migration flows often does not exist. Available migration data is usually based on information on foreign-born population stocks. New estimates developed by Guy Abel and Nikola Sander quantify bilateral international migration flows based on migration stock data from the United Nations. In order to communicate the new dataset on international migration, researchers from the Wittgenstein Centre for Demography and Global Human Capital together with coders from Null2 jointly developed a new interactive data visualisation, which illustrates the global flow of people (at www.global-migration.info).
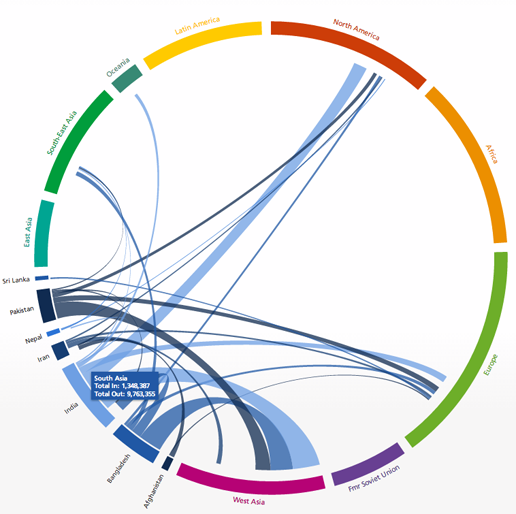
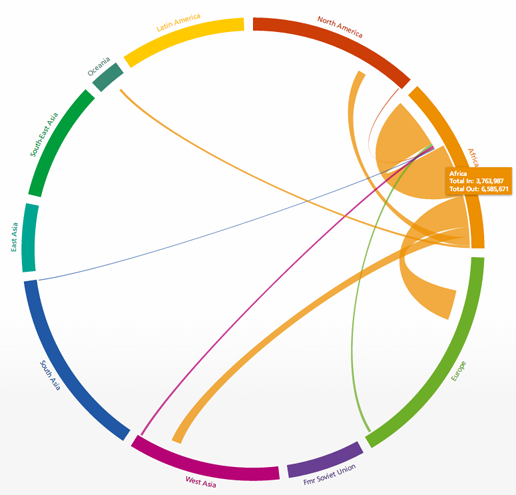
Visualising global migration flows is also rather tricky. Commonly used migration maps that visualise place-to-place flows often fall short of conveying the complexities of human movement in an effective and visually appealing manner. Based on a circular plot, this new approach for visualising migration flows allows to explore the global flow of people between and within regions, as well as for individual countries, for five-year periods between 1990 and 2010. By hovering across the plot, the data can be experienced intuitively – allowing to explore complex flows that are otherwise hidden in a table with some thousand cells (see screenshot below from www.global-migration.info).
For example, were you aware of the globalised nature of out-flows from South Asia, …

… or how strong migration flows are within Africa relative to flows from Africa to more developed regions?
Try it yourself! … and also watch the short animation (produced by Nikola Sander) that explains the complexity of estimating and visualising the global flow of people in just 4 minutes.
Links, references and data sources:
- The Global Flow of People – Online data visualisation by Nikola Sander, Guy Abel, Ramon Bauer, Johannes Schmidt, Andi Pieper, and Elvira Stein.
- Download the data: global migration flows (1990 – 2010) – Dataset by Wittgenstein Centre of Demography and Global Human Capital (IIASA, VID/OEAW, WU)
- Global Migration Data Sheet (2005–2010) – Poster (pdf) by Nikola Sander, Guy Abel and Ramon Bauer. Vienna Institute of Demography (Wittgenstein Centre).
- Quantifying Global International Migration Flows – Article by Guy Abel and Nikola Sander. Published in Science, 343 (6178) (Accepted Version).
- Visualising Migration Flow Data using Circos, R and d3.js – Article by Nikola Sander, Guy Abel, Ramon Bauer and Johannes Schmidt. VID Working Paper 02/2014, Vienna Institute of Demography.


Blog post by Guy Abel demonstrating how to do circular migration flow plots in R: http://gjabel.wordpress.com/2014/03/28/circular-migration-flow-plots-in-r/